Introduction
Choosing an embedding model for a RAG system in practice comes down to browsing MTEB leaderboards and picking the top-ranked model. But benchmarks evaluate models on general datasets, not on your data, not on your domain, not on your queries.
When implementing semantic search on AWS Bedrock, you face a specific question: which embedding model works better with your data? Amazon Titan Embeddings V2 or Cohere Embed v3? Or something else entirely? The answer depends on the domain and your data, and it needs to be found empirically.
The problem is that most embedding model comparisons boil down to cosine similarity on a handful of queries and a subjective conclusion. How can we statistically confirm our hypothesis?
We set out to find a reproducible mechanism for evaluating embedding models that can be applied to any pair of models on any data. The approach consists of three components:
- LLM-as-Judge — a large language model acts as a judge and evaluates search result quality using structured criteria (Zheng et al., 2023)
- Generalized Linear Model (GLM) — formalizes the relationship between the model and result quality, with linking function selection via AIC
- Likelihood Ratio Test — determines whether the difference between models is statistically significant
As a demonstration we compared four models: Amazon Titan V1, V2 (AWS Bedrock) and all-MiniLM-L6-v2, bge-small-en-v1.5 (open-source). But the models are just an example. What matters is the mechanism itself, which you can replicate in your own project.
Methods
Data and Models
We used a dataset of 6,000 products in the nutrient domain, indexed in pgvector. For evaluation we created 100 search queries of different types, from specific product names to general categories. Each query was processed by four embedding models, two cloud-based (AWS Bedrock) and two local (open-source):
AWS Bedrock (cloud, managed):
- Amazon Titan Embeddings V1 (amazon.titan-embed-text-v1), first generation, 1536 dimensions
- Amazon Titan Embeddings V2 (amazon.titan-embed-text-v2:0), new generation, 1024 dimensions
Open-source (local, Transformers.js):
- all-MiniLM-L6-v2, the most popular open-source embedding model, 384 dimensions
- bge-small-en-v1.5, a model from BAAI with high MTEB scores, 384 dimensions
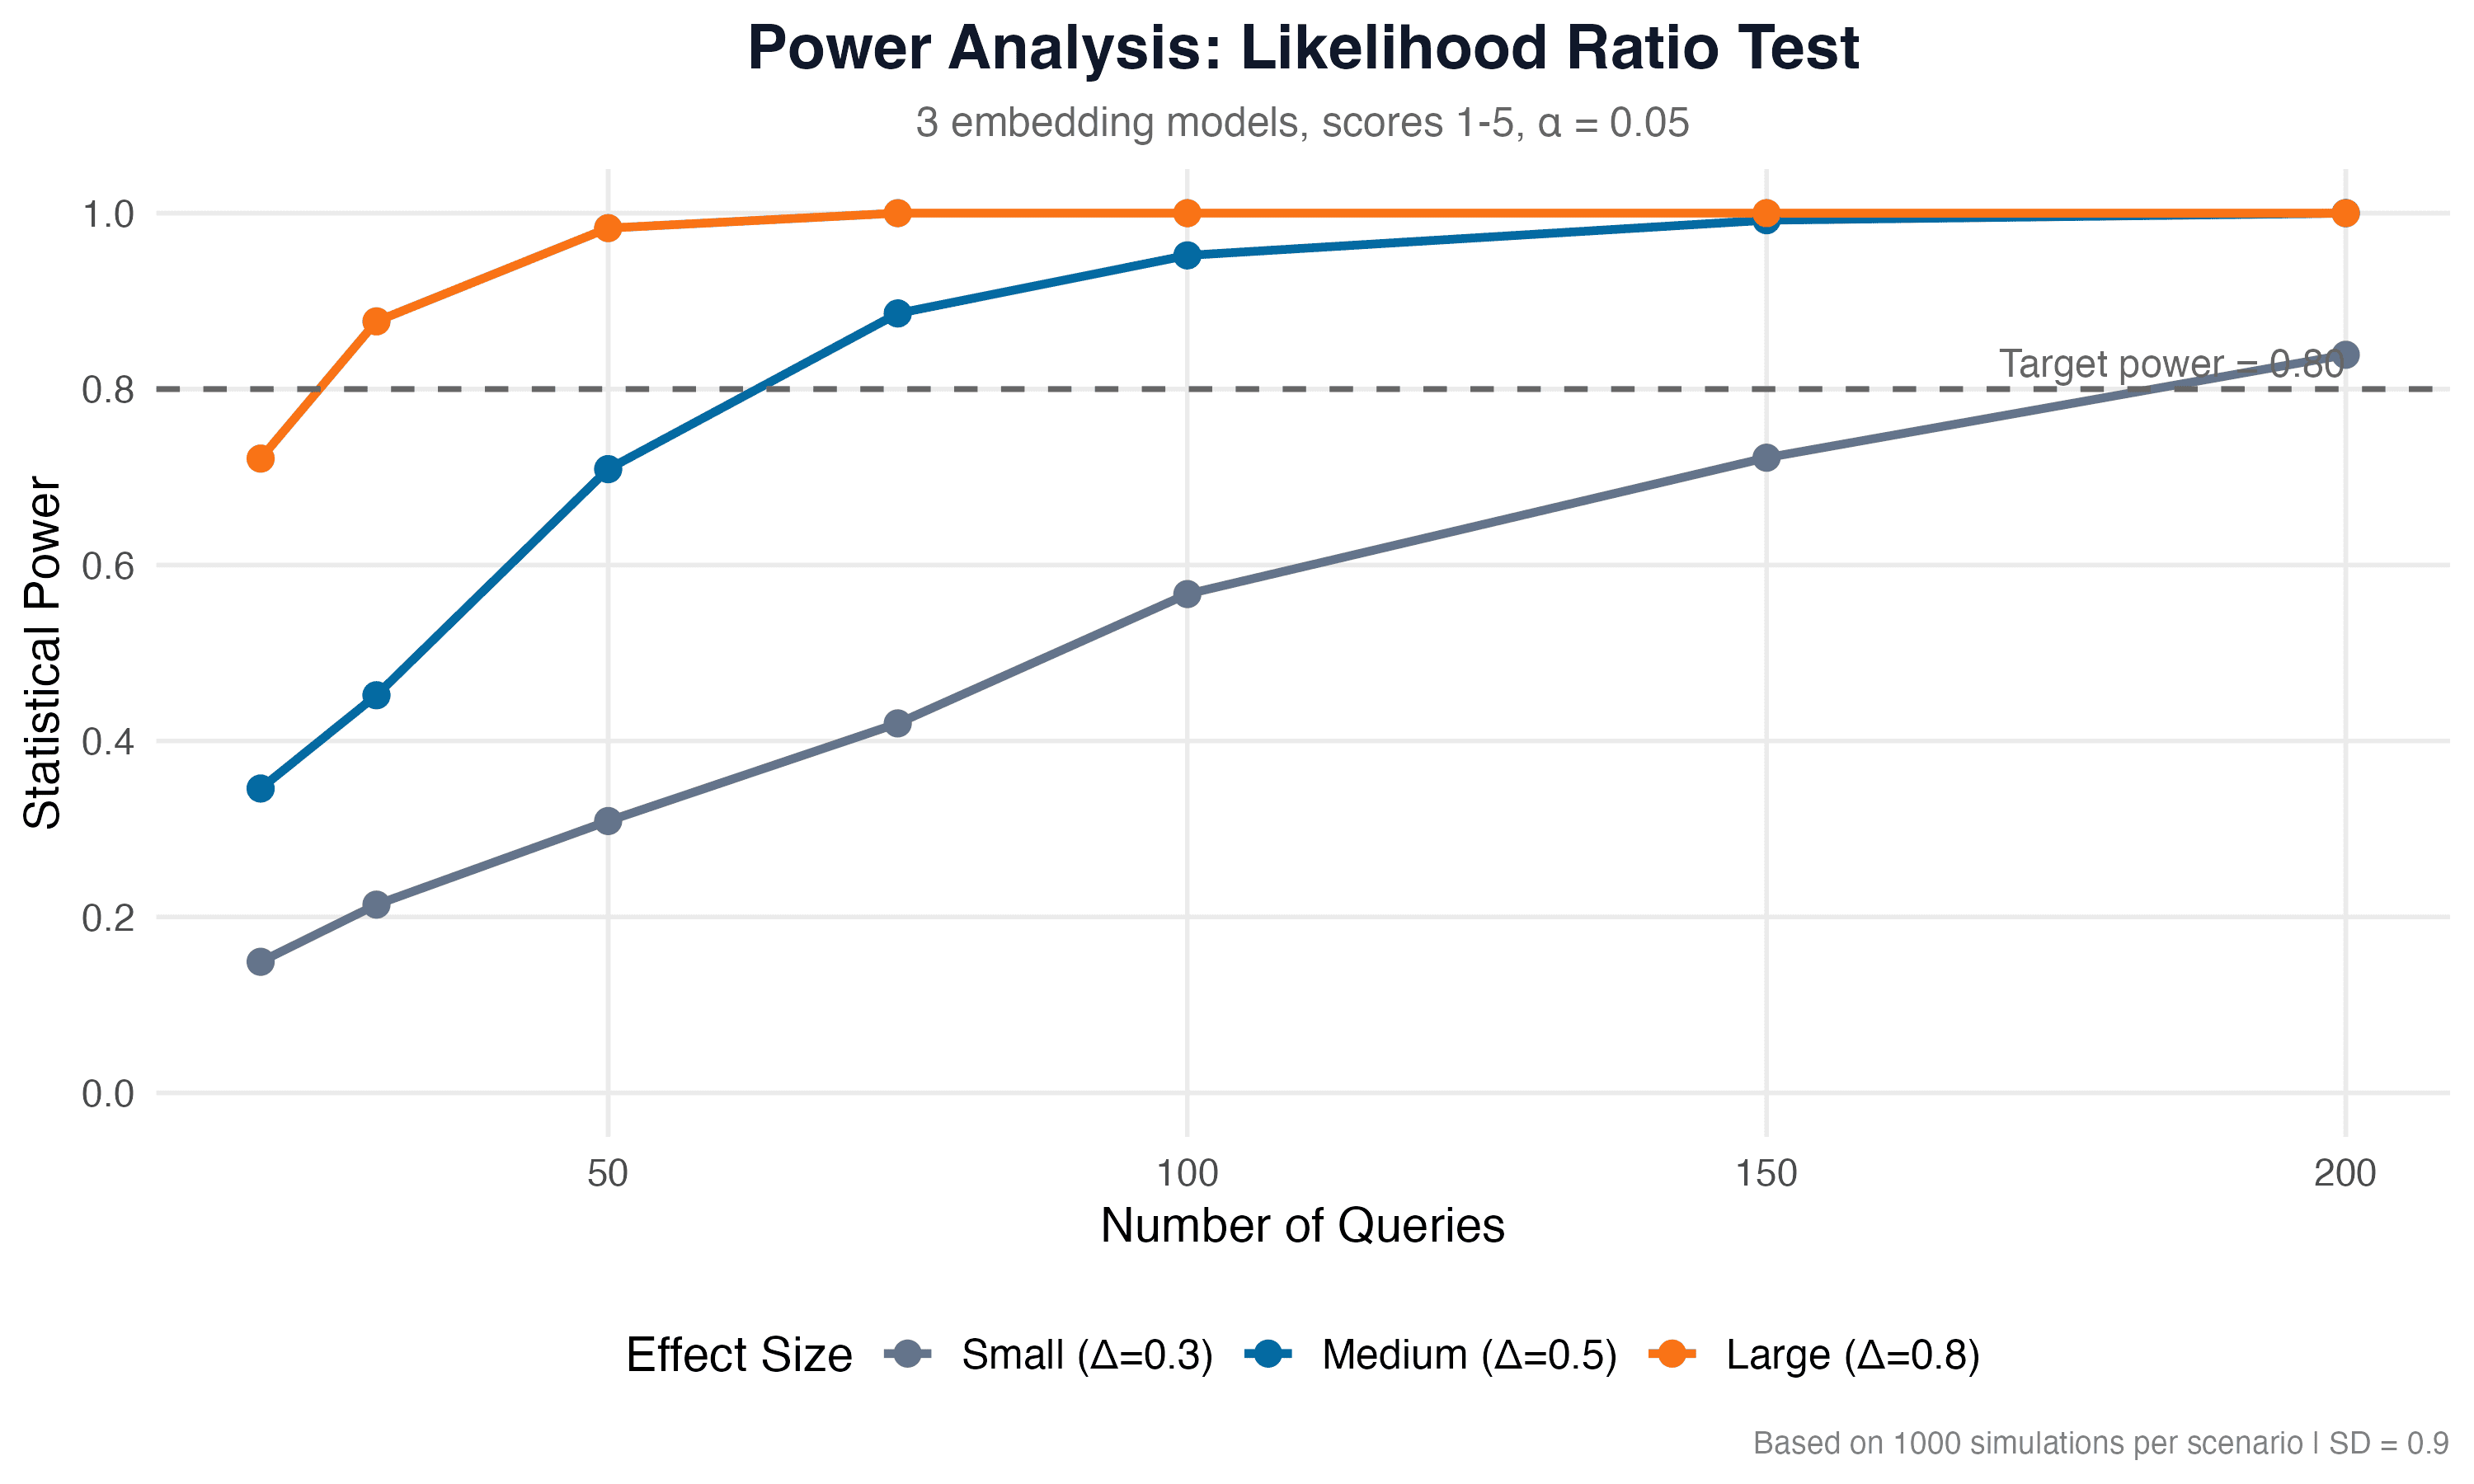
Search results, top-5 documents per query, were stored for subsequent evaluation. The number of queries (100) was determined through power analysis using the lmtest and ggplot2 packages in R, ensuring statistical power of 0.80 or higher for detecting medium and large effects (α = 0.05).
LLM-as-Judge
To evaluate search result quality we used the LLM-as-Judge approach (Zheng et al., 2023). Claude evaluated each "query, top-5 results" pair on a scale of 1 to 5 across three criteria:
- Relevance — how well the results match the query
- Ranking — whether the most relevant documents are ranked higher
- Coverage — whether the results cover all aspects of the query
For each "query × model" combination the LLM generated a structured response with scores and a brief justification. This gave us 400 observations (100 queries × 4 models) with three numerical scores each.
Generalized Linear Model (GLM)
We analyzed the scores using GLM in R with the stats, MASS, and lmtest packages. The dependent variable was the quality score (1-5), the independent variable was the embedding model. Since the scores are ordinal, the choice of linking function matters. We tested four variants — identity, log, inverse, logit — and selected the best one using the Akaike Information Criterion (AIC). The model with the lowest AIC best describes the relationship between the embedding model and search quality.
Likelihood Ratio Test
To test the statistical significance of the difference between models we used the likelihood ratio test from the lmtest package. We compared two models: a null model (the score does not depend on the embedding model) and an alternative model (the embedding model affects the score). If the p-value is less than 0.05, we have statistical grounds to claim that the choice of embedding model has a significant impact on search result quality.
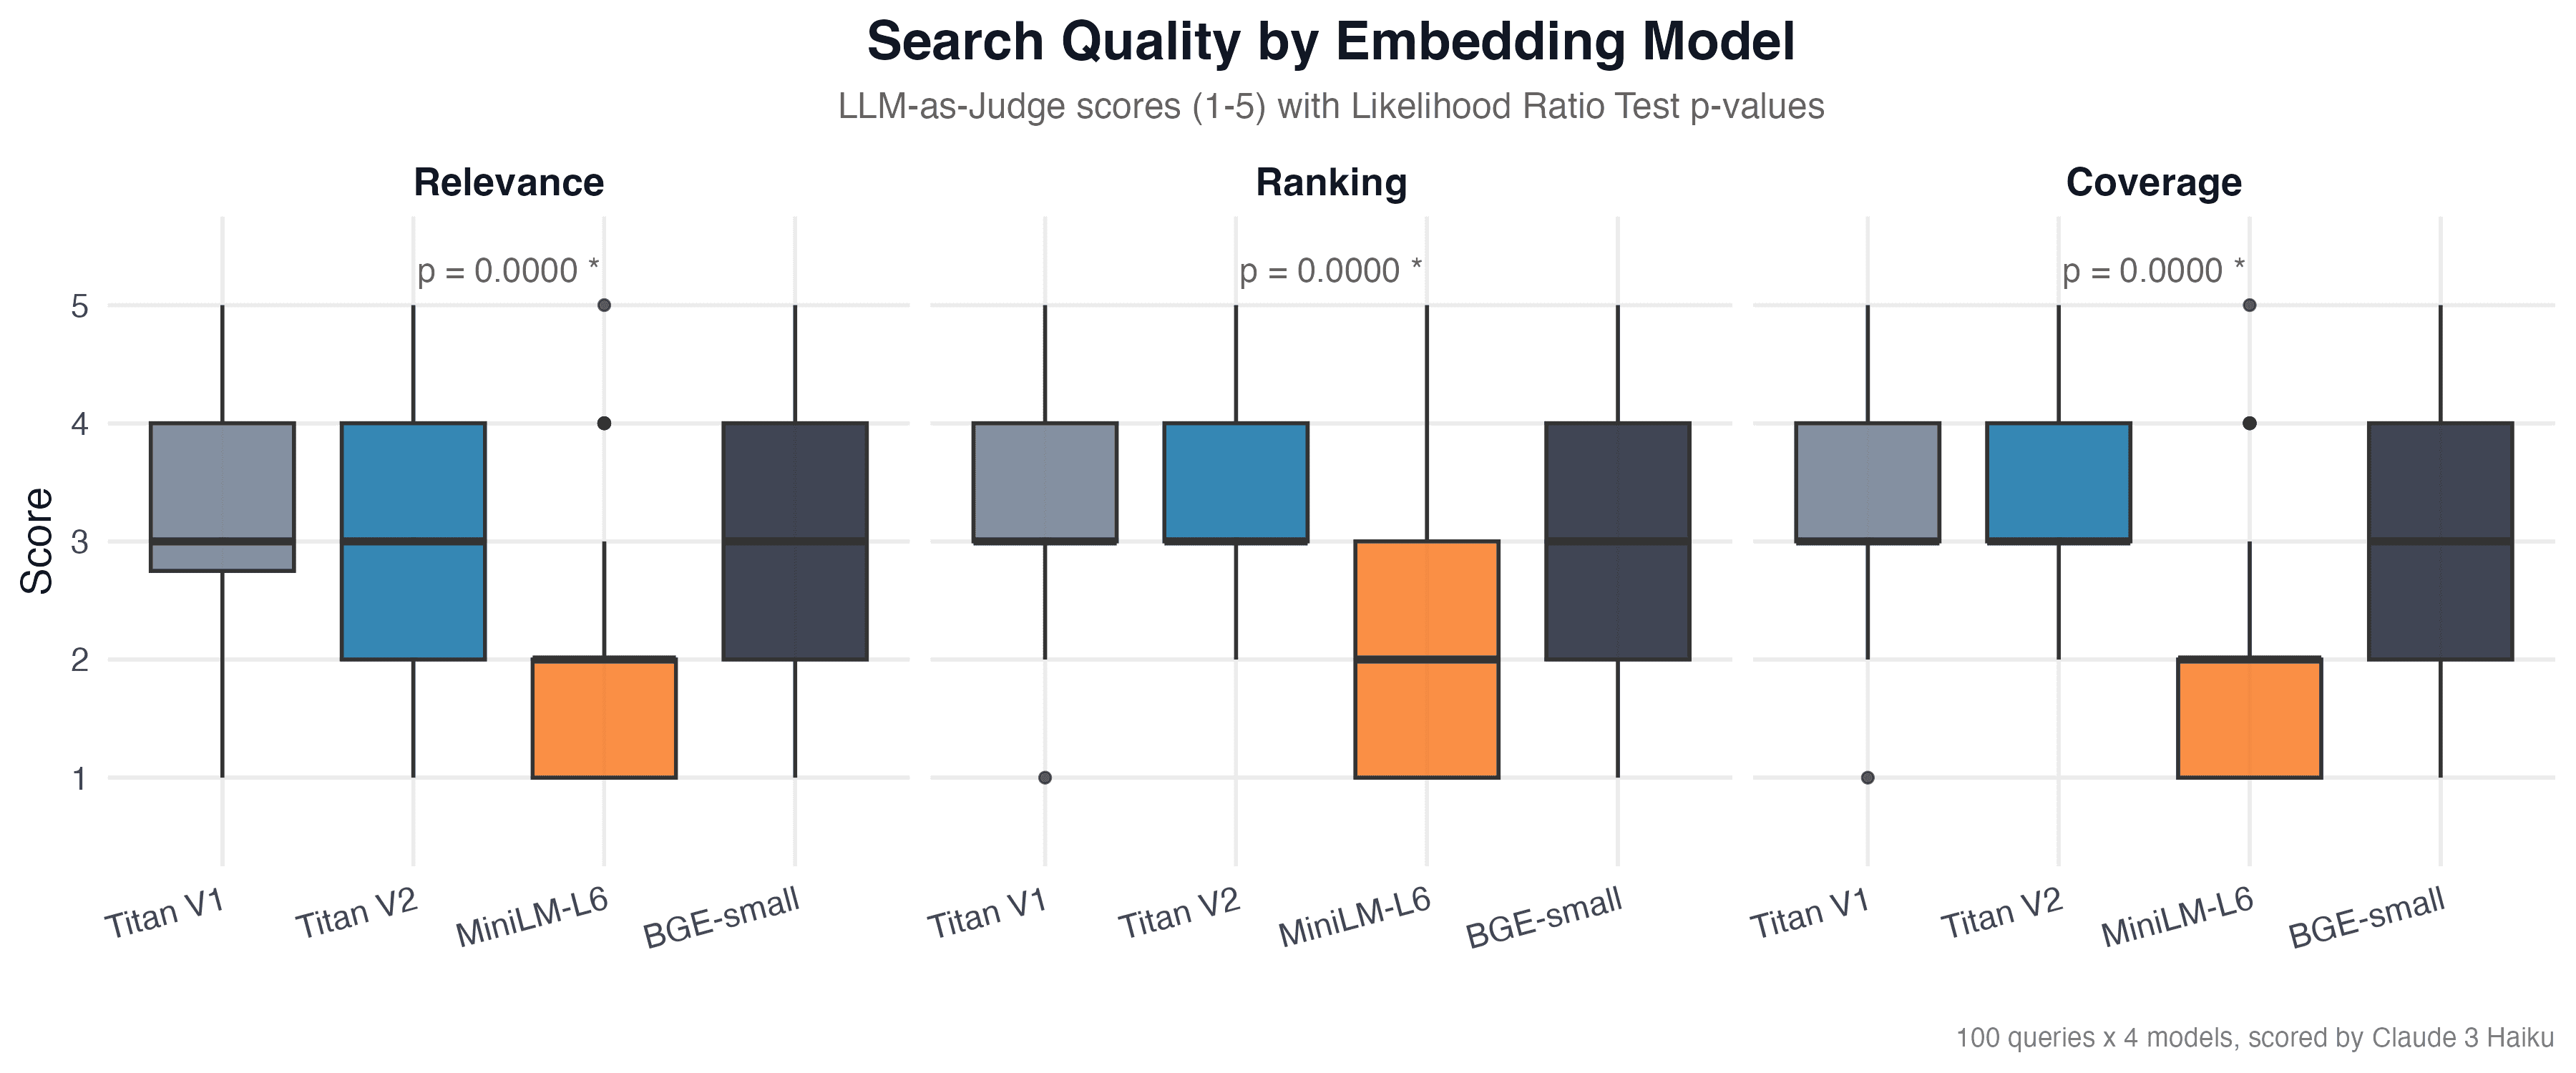
Visualization
We visualized the results in R using ggplot2. For each criterion (relevance, ranking, coverage) we built:
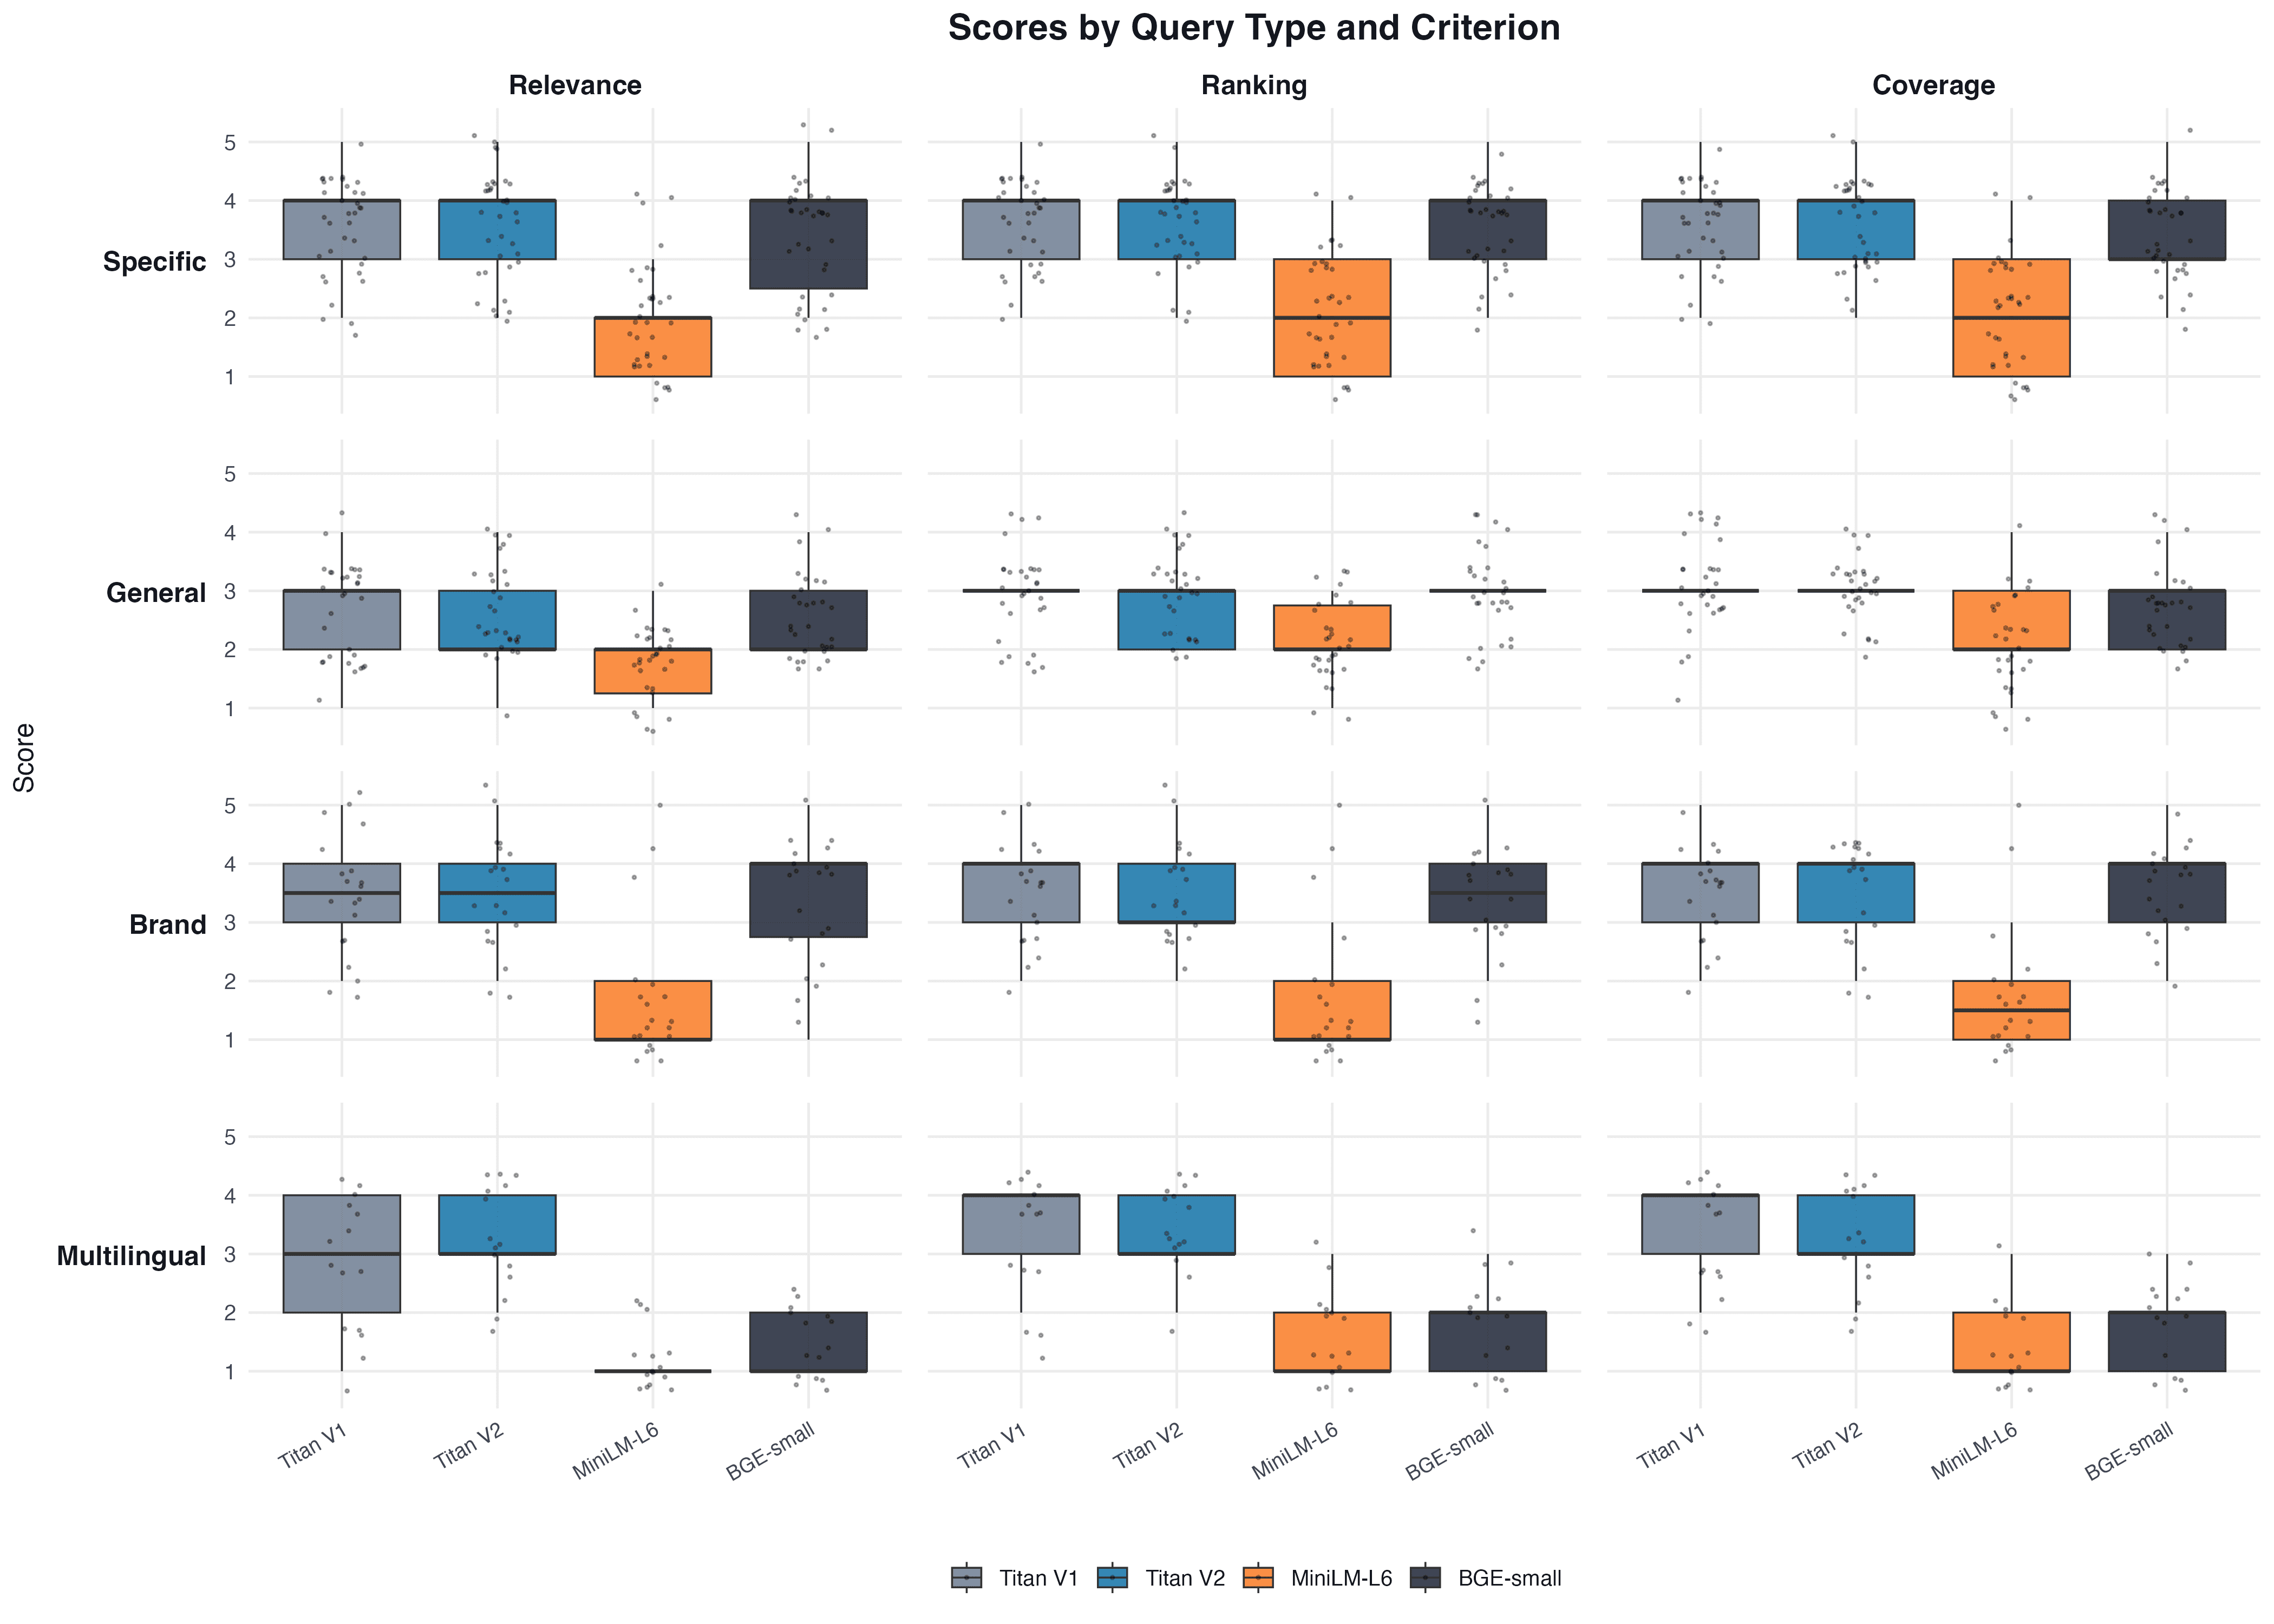
- Box plot — score distribution across models
- Bar plot with confidence intervals — mean scores with 95% CI
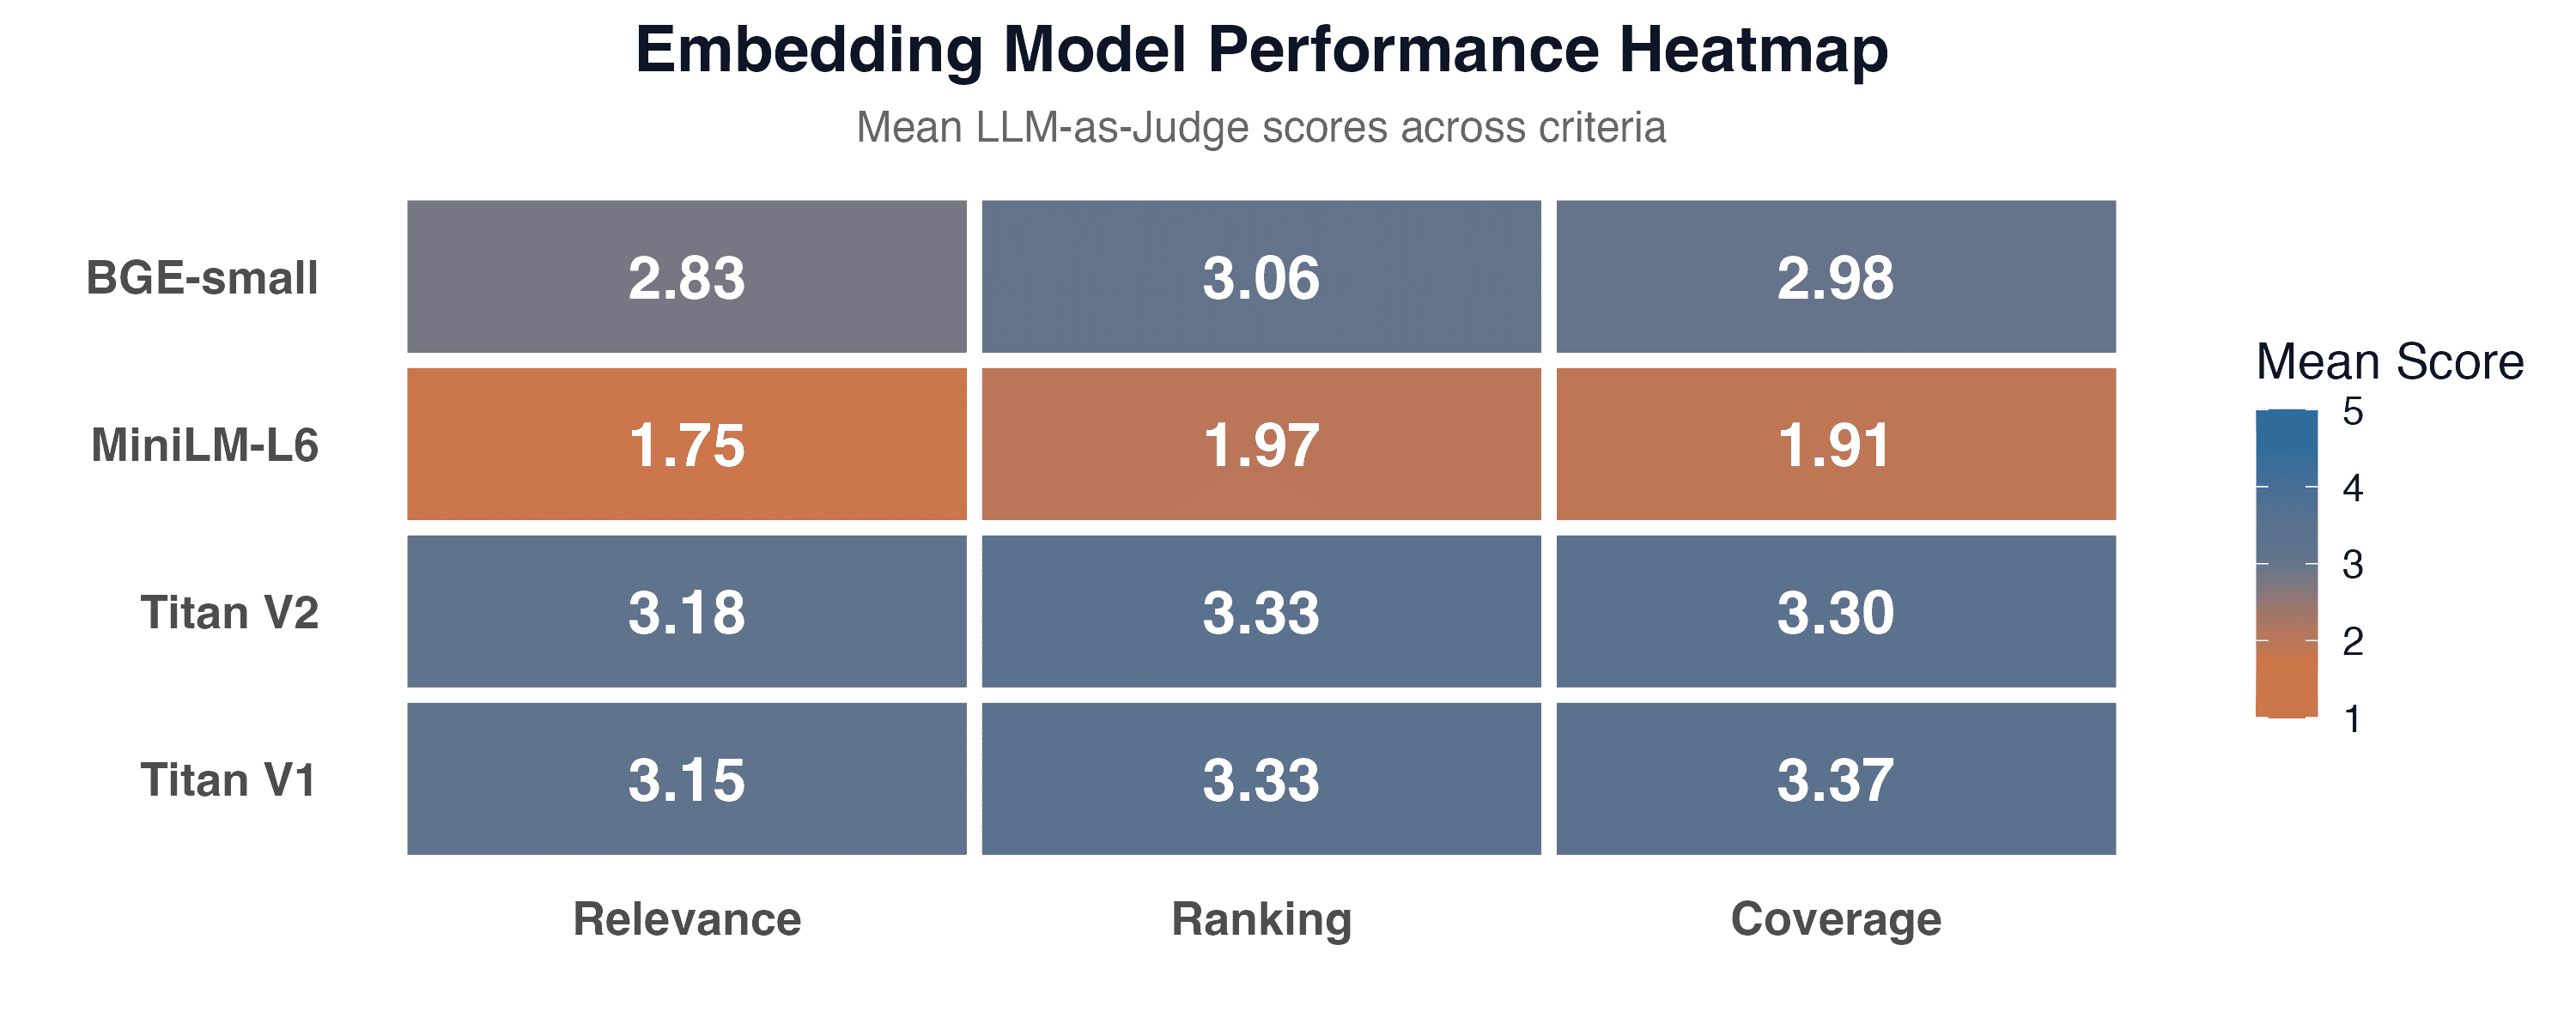
- Heatmap — model comparison across all criteria simultaneously
Each chart is accompanied by a p-value from the likelihood ratio test.
Results
Power Analysis
Before collecting data we conducted a simulation-based power analysis to determine the required number of queries. For a medium effect (Δ = 0.5) 100 queries provide a power of 0.952, for a large effect (Δ = 0.8) power reaches 1.0. This means 100 queries are sufficient for detecting practically significant differences between models at α = 0.05.
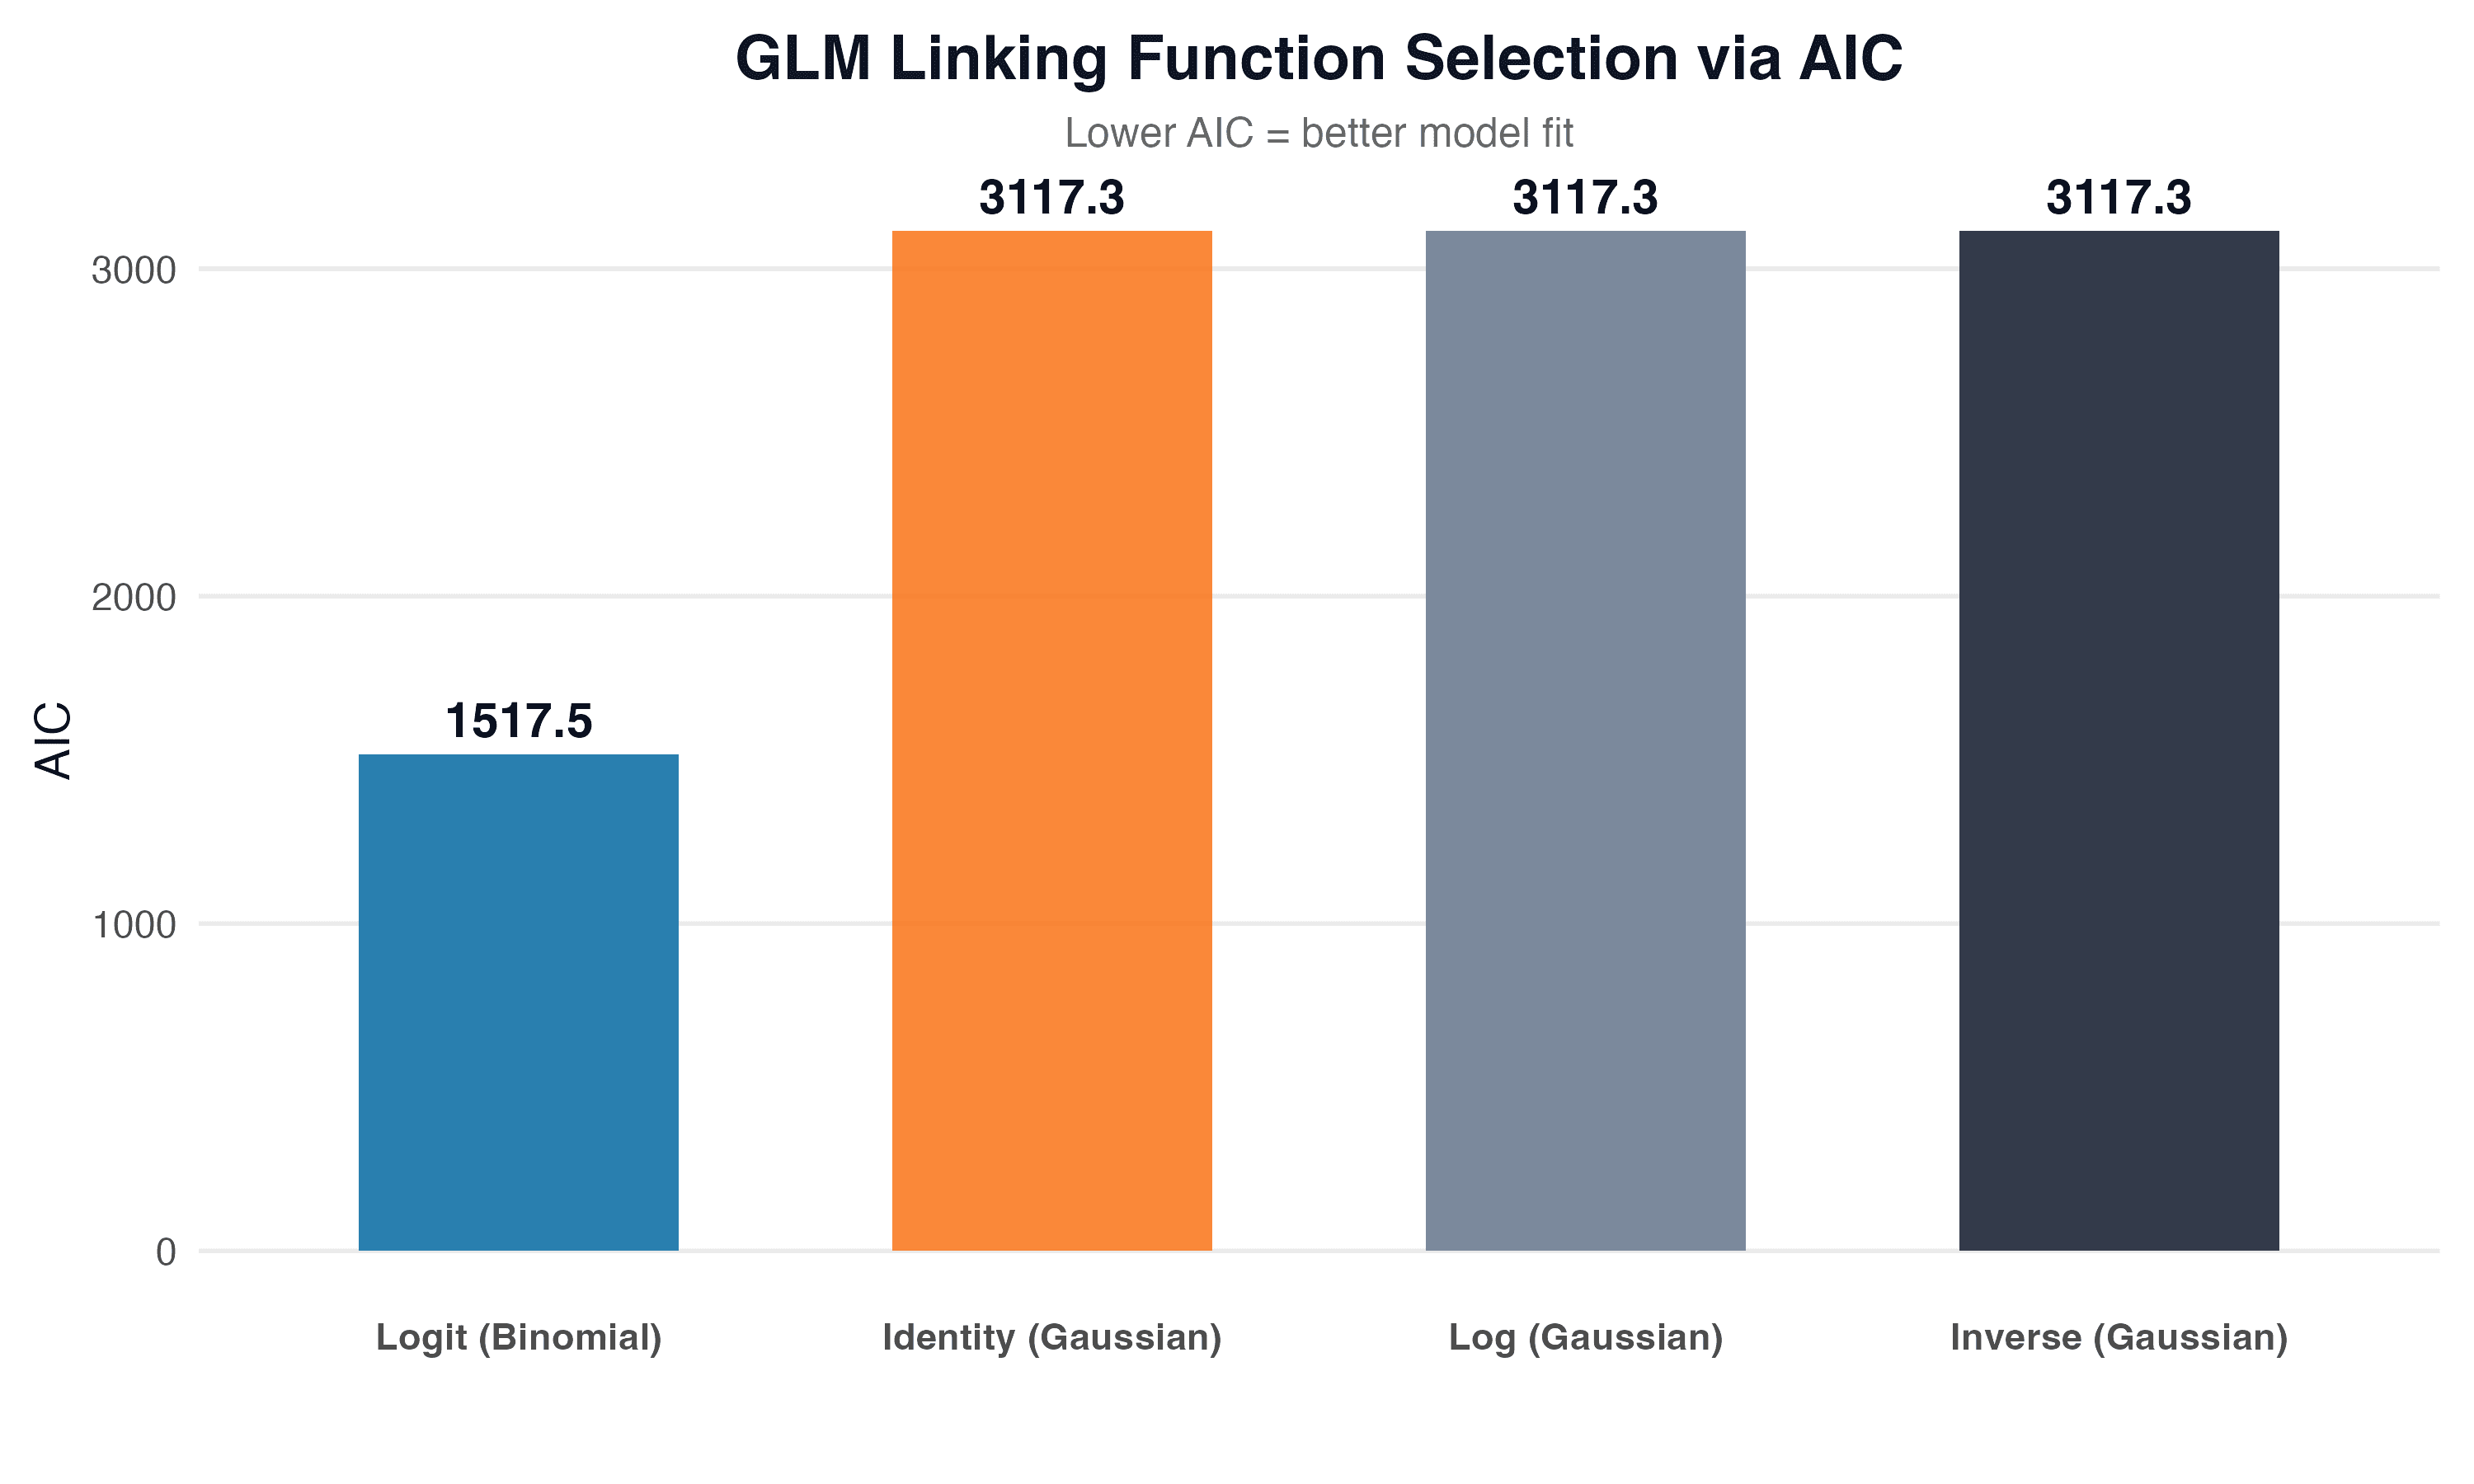
Linking Function Selection
We tested four linking functions for GLM and selected the best one using the Akaike Information Criterion (AIC):
| Linking function | AIC |
|---|---|
| Identity (Gaussian) | 3117.3 |
| Log (Gaussian) | 3117.3 |
| Inverse (Gaussian) | 3117.3 |
| Logit (Binomial) | 1517.5 |
Logit (Binomial) achieved the lowest AIC by a large margin (1517.5 vs. 3117.3), indicating a significantly better fit to the data. This makes sense: scores are bounded to the 1-5 range, and the logit link correctly models such a bounded dependent variable.
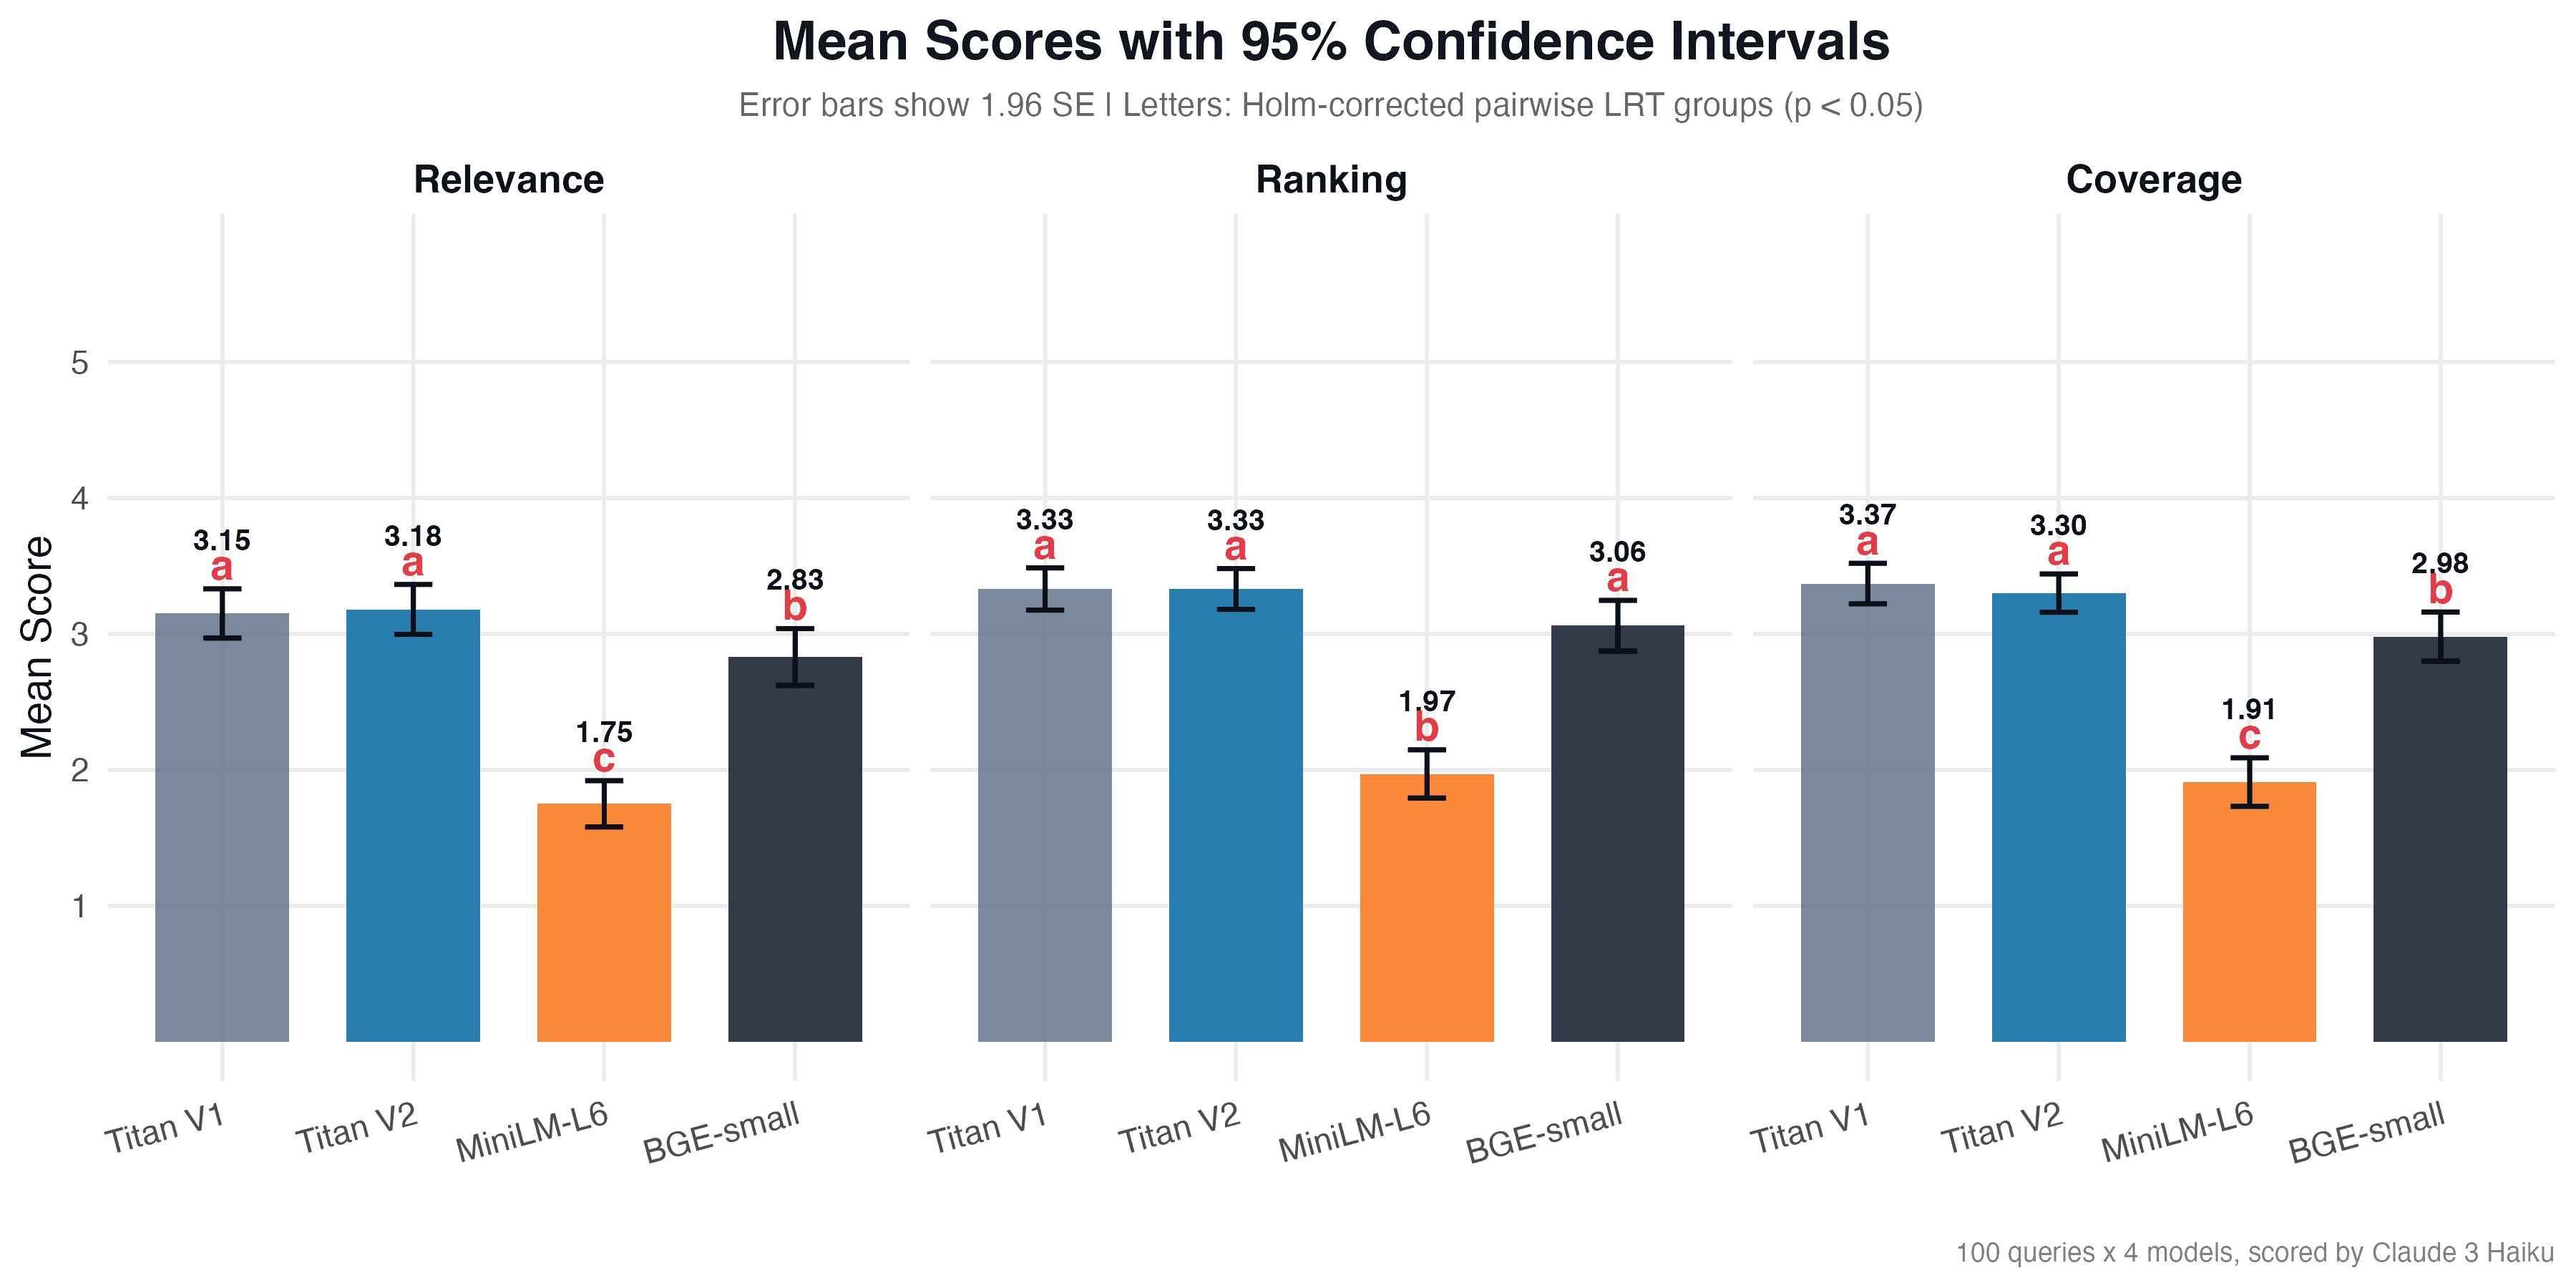
Descriptive Statistics
Mean scores (scale 1-5) per criterion:
| Model | Relevance | Ranking | Coverage |
|---|---|---|---|
| Titan V1 | 3.15 (SD = 0.93) | 3.33 (SD = 0.79) | 3.37 (SD = 0.76) |
| Titan V2 | 3.18 (SD = 0.94) | 3.33 (SD = 0.77) | 3.30 (SD = 0.72) |
| BGE-small | 2.83 (SD = 1.06) | 3.06 (SD = 0.95) | 2.98 (SD = 0.92) |
| MiniLM-L6 | 1.75 (SD = 0.87) | 1.97 (SD = 0.90) | 1.91 (SD = 0.91) |
Titan V1 and V2 showed the highest mean scores across all criteria. BGE-small falls slightly behind but remains in the 2.8-3.1 range. MiniLM-L6 lags significantly with scores of 1.75-1.97.
Likelihood Ratio Test
For each criterion we compared a null model (the score does not depend on the embedding model) with an alternative model (the embedding model affects the score):
| Criterion | χ² | p-value | Significance |
|---|---|---|---|
| Relevance | 127.8 | 1.60 × 10⁻²⁷ | *** |
| Ranking | 143.8 | 5.63 × 10⁻³¹ | *** |
| Coverage | 161.7 | 7.99 × 10⁻³⁵ | *** |
| Overall | 428.7 | 1.33 × 10⁻⁹² | *** |
All p-values are far below α = 0.05. The choice of embedding model has a statistically significant impact on search quality across all criteria. The overall test (χ² = 428.7, p = 1.33 × 10⁻⁹²) confirms that the difference between models is not due to chance.
Comparison by Query Type
We also analyzed the results across query types (specific, general, brand, multilingual). The results show that the difference between models persists regardless of query type, although the magnitude varies.
Discussion
The omnibus likelihood ratio test showed that the choice of embedding model has a statistically significant impact on search quality (χ² = 428.7, p = 1.33 × 10⁻⁹²). But this result alone does not answer the question "which specific models differ." Post-hoc pairwise comparisons with Holm correction provide a concrete picture: Titan V1 and V2 do not differ from each other (p = 0.82 for relevance, p = 1.0 for ranking, p = 0.50 for coverage), while MiniLM-L6 is significantly worse than all other models on every criterion (all p < 10⁻¹³). BGE-small occupies an intermediate position: for ranking it is not statistically different from the Titans (p_adj = 0.08), but for relevance and coverage the difference is significant (p_adj < 0.05).
It is important to note the limitations of the approach. LLM-as-Judge has its own biases (Zheng et al., 2023): Claude may systematically inflate or deflate scores. However, for relative comparison between models these biases are constant and do not affect the validity of the likelihood ratio test. Results also depend on the domain: a model that performs well on nutrients may fall short on legal or medical texts. Analysis by query type showed that the difference between models persists for specific, general, brand, and multilingual queries, although the magnitude varies. MiniLM-L6, as a monolingual model, predictably showed the worst results on multilingual queries (median = 1 for relevance).
The practical value of the mechanism lies in its reproducibility. The entire pipeline (embedding generation, LLM-as-Judge, GLM with linking function selection via AIC, post-hoc pairwise comparisons with Holm correction) can be run on new data within an hour and produce a statistically grounded answer instead of a subjective "this model seems better."
Conclusion
We built a reproducible mechanism for evaluating embedding models and tested it on four models (Amazon Titan V1, V2, all-MiniLM-L6-v2, bge-small-en-v1.5) using 6,000 products in the nutrient domain. The mechanism includes: power analysis for determining the number of queries, LLM-as-Judge for automated evaluation, linking function selection via AIC (logit proved optimal), omnibus LRT, and post-hoc pairwise comparisons with Holm correction.
Results revealed three distinct groups: Titan V1/V2 (group "a", mean scores 3.15-3.37), BGE-small (group "b", 2.83-3.06), and MiniLM-L6 (group "c", 1.75-1.97). Titan V1 and V2 showed statistically identical results (p = 0.82-1.0 across all criteria), even though V2 is positioned as a new generation with greater capabilities and a higher price. For semantic search tasks in the e-commerce domain, no difference between generations was found, allowing you to choose the cheaper option without sacrificing quality.
The main result of this work is not the model ranking but the mechanism itself. You can replace the models, data, and evaluation criteria with your own and get a statistically grounded answer for your domain.
References
- Muennighoff, N. et al. (2023). "MTEB: Massive Text Embedding Benchmark." EACL 2023. doi:10.18653/v1/2023.eacl-main.148
- Zheng, L. et al. (2023). "Judging LLM-as-a-Judge with MT-Bench and Chatbot Arena." NeurIPS 2023. arXiv:2306.05685
- Saad-Falcon, J. et al. (2024). "ARES: An Automated Evaluation Framework for Retrieval-Augmented Generation Systems." NAACL 2024. doi:10.18653/v1/2024.naacl-long.20